High-Quality Instructional Materials Implementation Dashboard

Turn data into action.

Copy of Untitled Design

Know your next move.

What’s happening across 100 schools? Curriculum implementation is notoriously hard to monitor and track. The Implementation Dashboard changes that.

Get instant insights and a clear plan to keep curriculum on track, driving results for students.

Schedule Your 15-Minute Walkthrough

What does the Dashboard do?

Focuses on impact-driven data

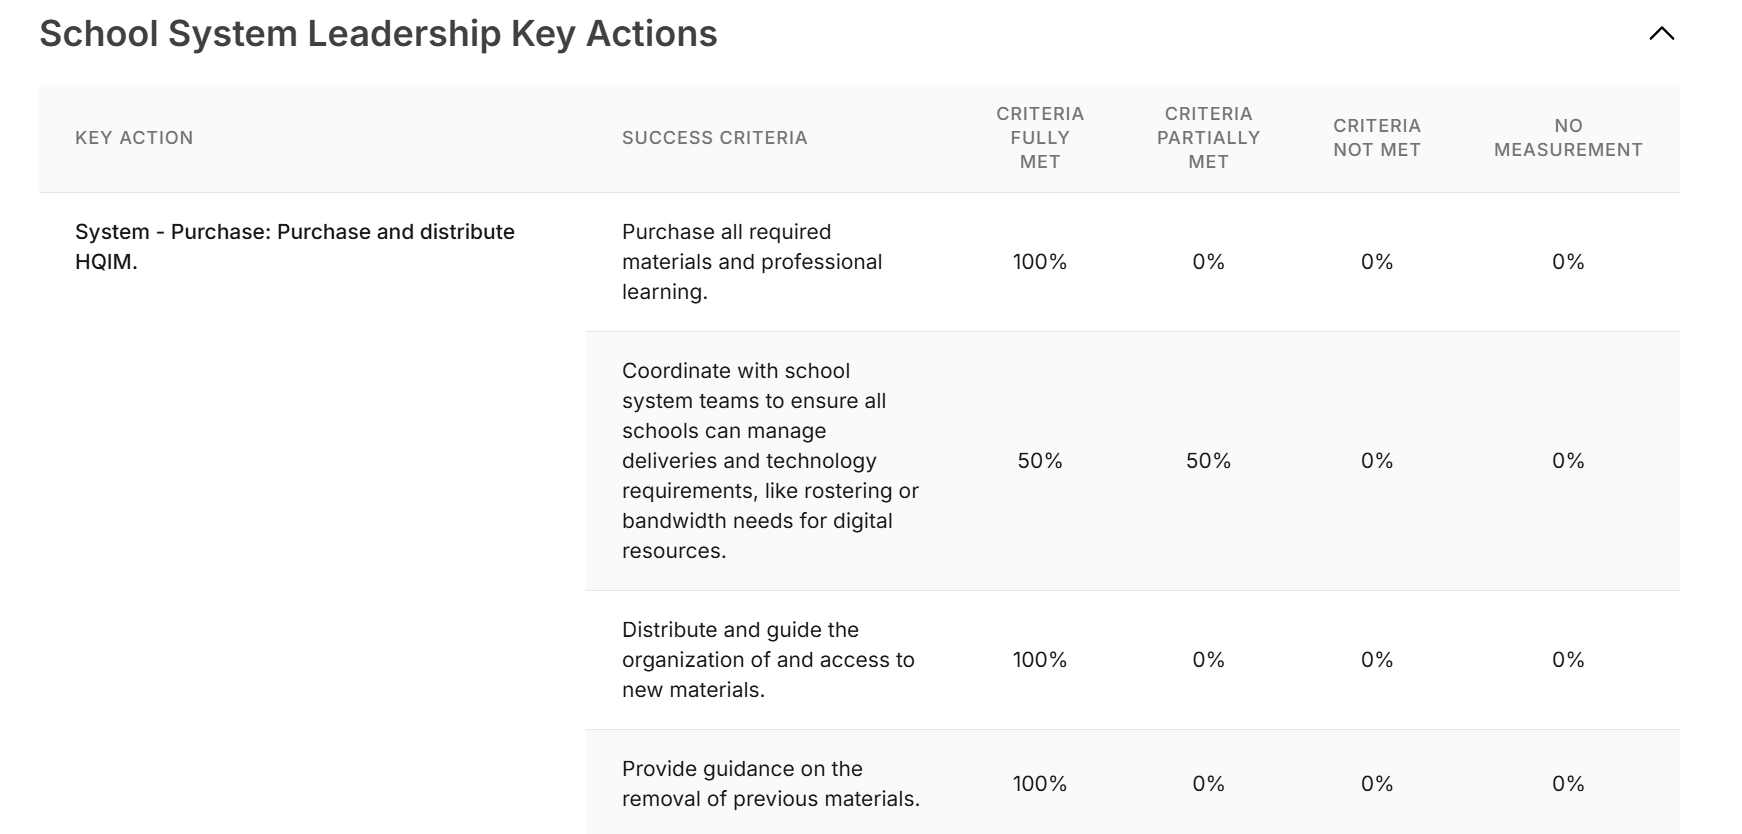
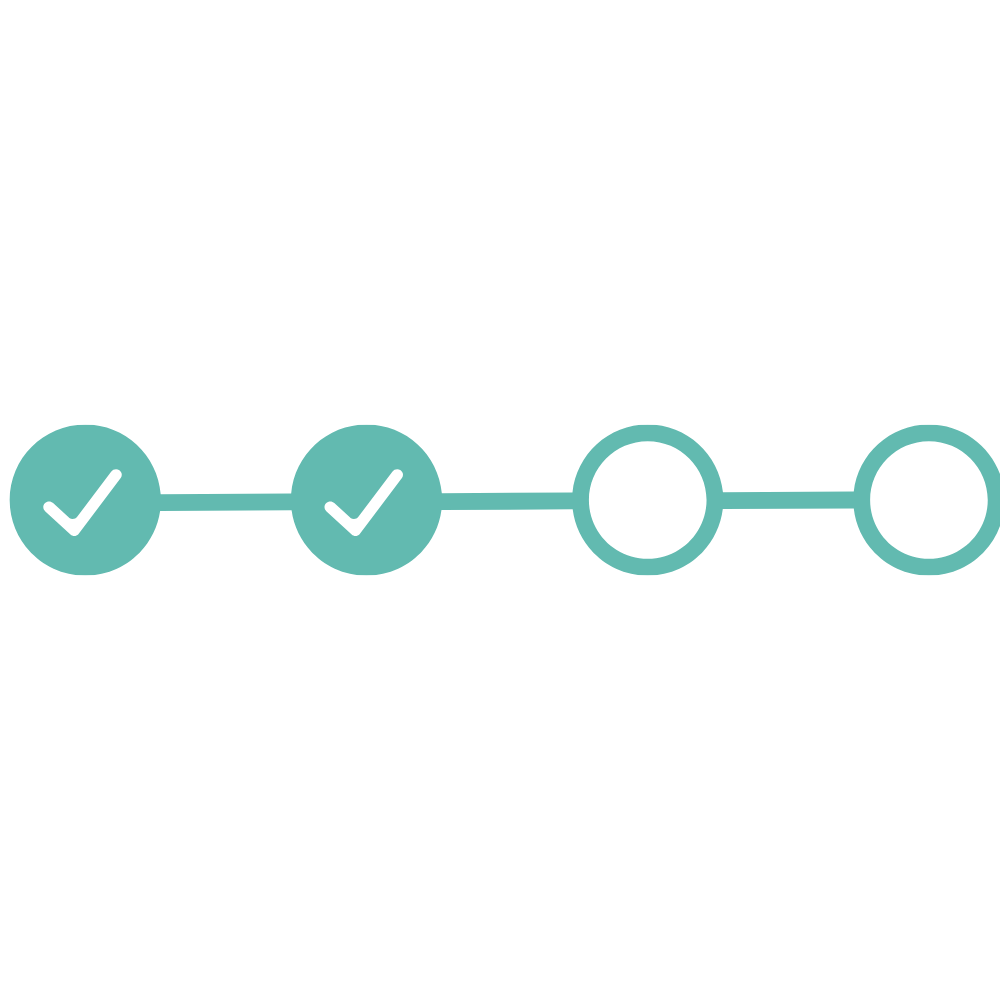
Curriculum implementation occurs across five phases. Focus on the data points that align with curriculum implementation success in each phase.

Simplifies collection & automates analysis

Manual data collection, synthesis, and trend analysis are prone to errors and can take weeks or even months. The Dashboard takes that job off your plate, delivering data you can trust.

Tracks progress over time

Data matters. Implementation data can be lost year-to-year or leader-to-leader, making it hard to see impact and lessons learned. With the Dashboard, your data is stored securely year over year.

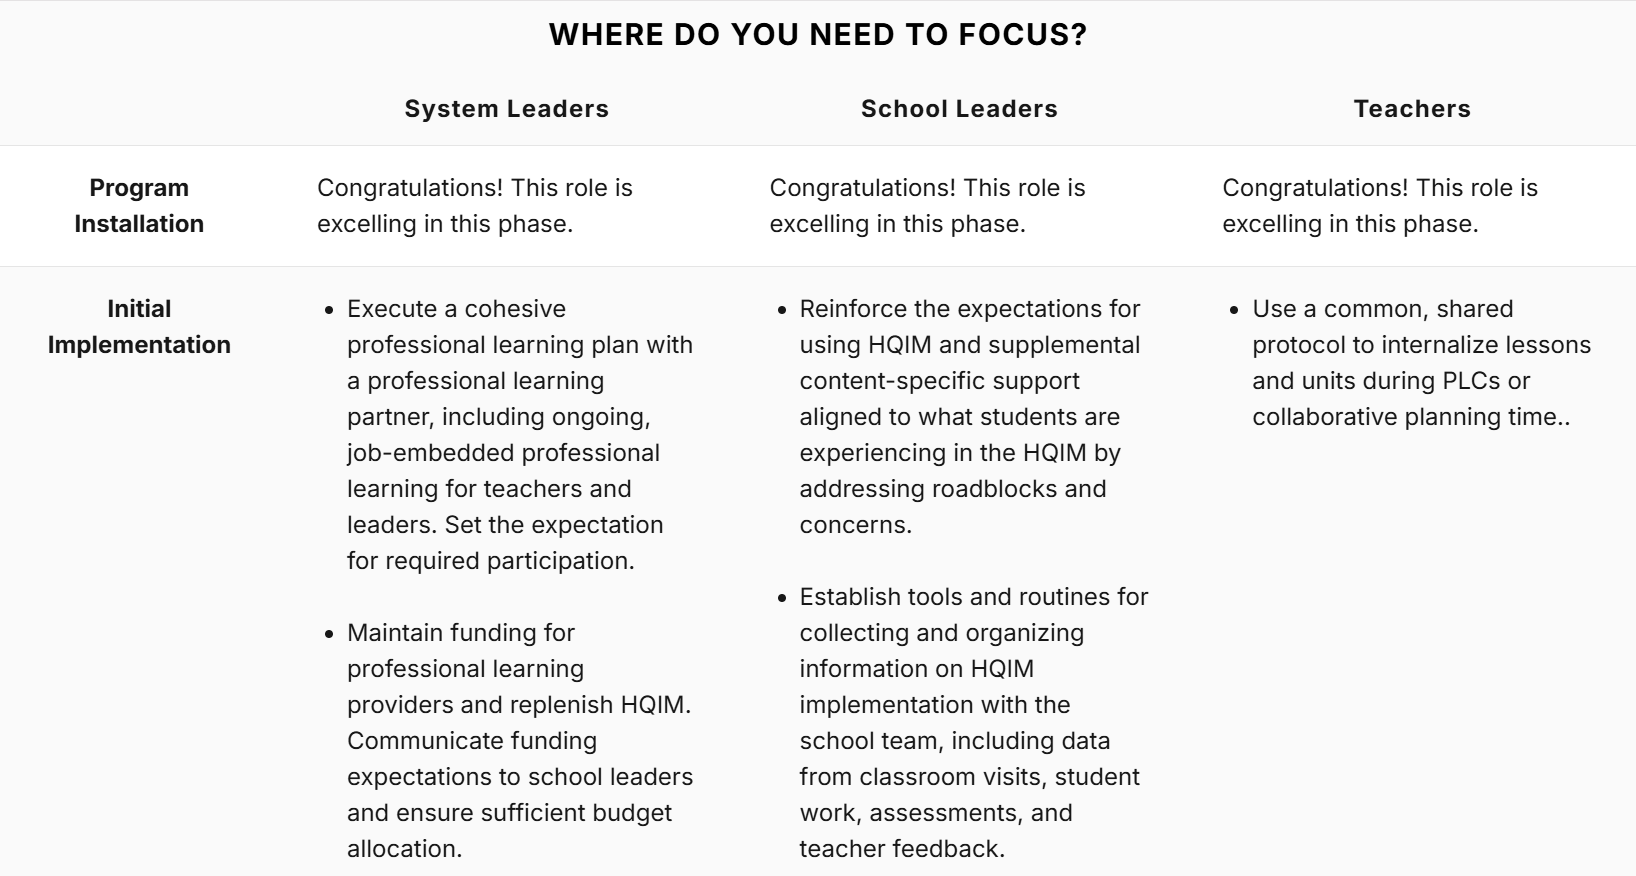
Clarifies next steps for stronger curriculum implementation

The Dashboard gives a focused to-do list based on your system's data. Eliminate the guesswork on what to prioritize.

How does the Dashboard work?

Data Captures

The Dashboard captures data twice a year using quick, digital self-assessments and teacher observations related to curriculum implementation activities.

Untitled design (76)
Trend Analysis

The Dashboard analyzes data from across the system to identify trends by key action and success criteria for each role: system leaders, school leaders, and teachers.

Untitled design (74)
Clear Scores

Three types of scores give insight into three critical levels of implementation activity. See an overall district score, key action scores, and school scores.

Score pages from the curriculum implementation dashboard
Next Steps

The Dashboard generates a What’s Going Well?” and “Where to Focus?” list to help you celebrate successes and identify a focused set of to-do’s.

Untitled design (75)

Dashboard Benefits Grid

Tiered Pricing

Tiered pricing so you only pay for what you use.

State Education Agencies

Explore more.

Know where you are in the implementation journey.

Track the data that matters.

Get the bird’s eye view of implementation.

Spot trends, shape strategy, and drive implementation progress across the state.

Get concrete next steps.

Access a role-specific to-do list to continue your implementation journey.

Scroll to Top